
Energy use you can see
One electricity bill at month end becomes an energy structure traceable by day and by circuit, which supports management decisions.
Smart circuit breakers and power monitoring: energy use you can see, hazards you are warned about.
Delivery Delivered on our standard energy SaaS platform, with power sensing device onboarding and tuning during implementation. Private deployment available.
Challenges
To save energy you first need to see where it goes. To stay safe you first need to know what is over the limit.
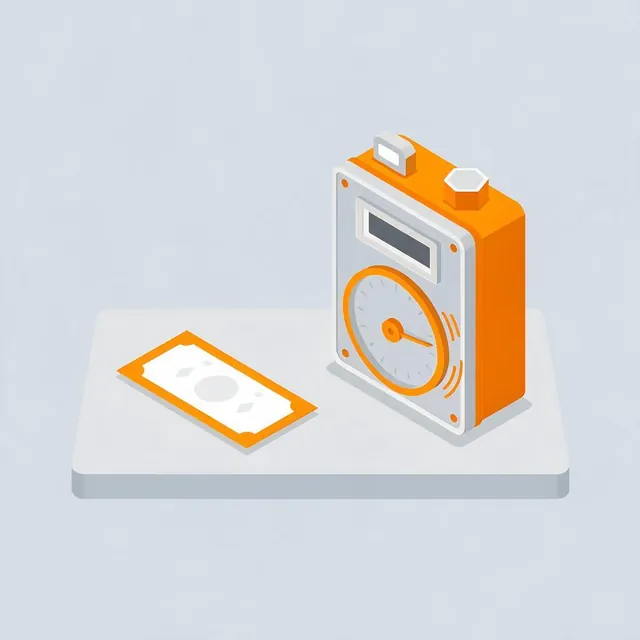
Beyond the main and sub meters there is no breakdown, so no one can say which building or device uses the power.
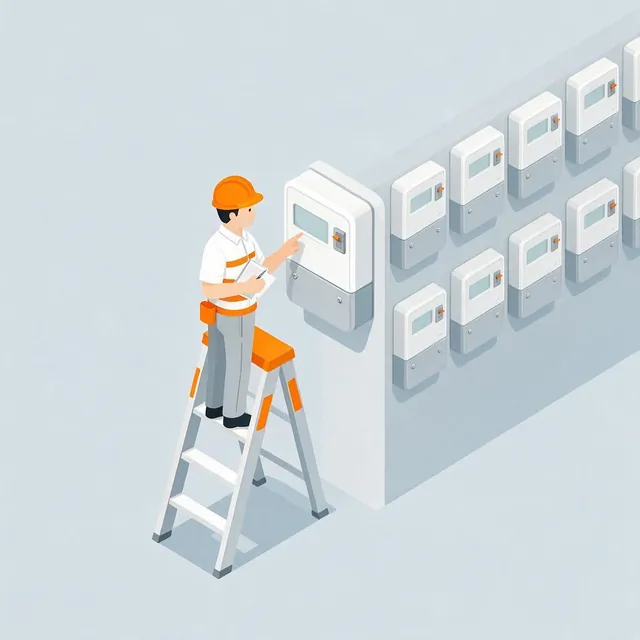
With many floors and scattered meter locations, one round takes days, and the numbers often do not match.
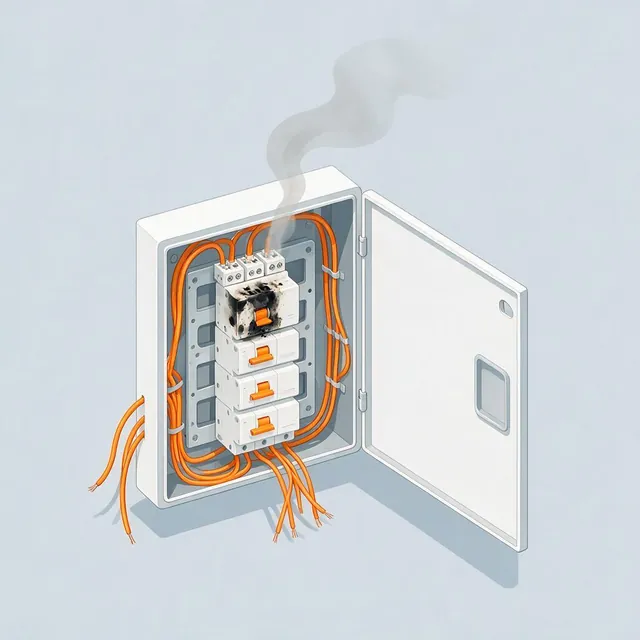
Overload, leakage and cable temperature are not monitored, so the first sign is a tripped breaker or smoke.
There is no history to base strategy changes on, and no way to verify the effect afterwards.
Key features
One setup covers four everyday jobs, with no need to reconcile data across several systems.
Industries
Facility managers who need to see the power and keep it under control.
What’s delivered
Circuit sampling and report definitions are delivered together, so you end up with energy data that reconciles with your bills.
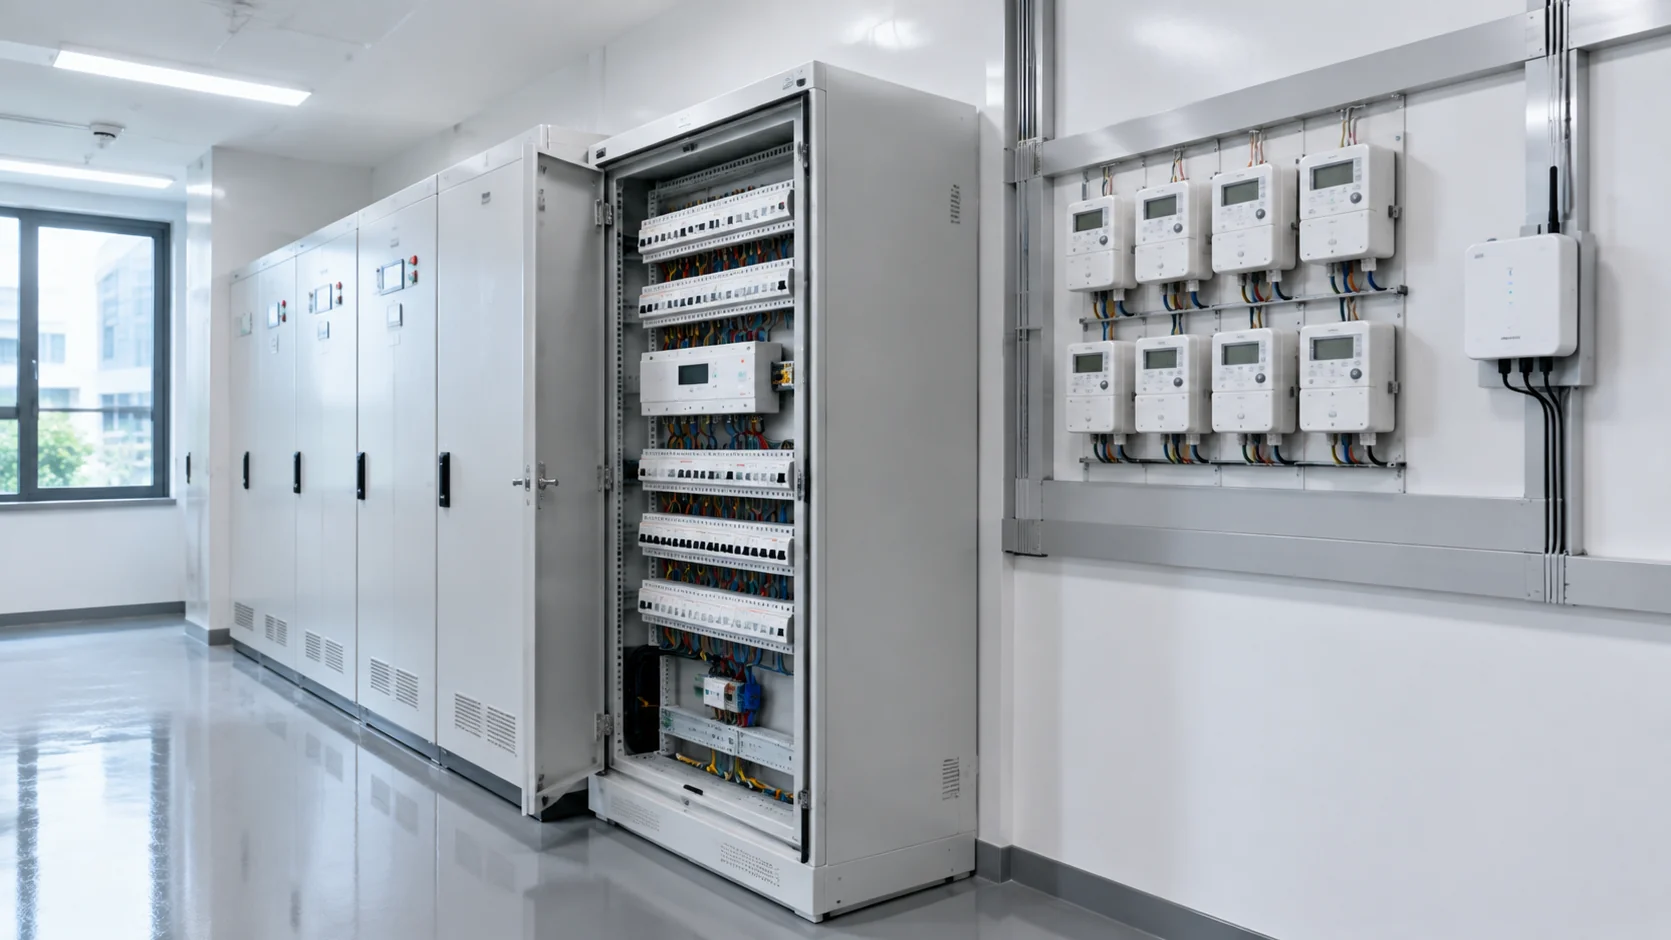
Smart circuit breakers, multi-circuit monitoring terminals, and water and power meters are installed by floor and circuit. The retrofit fits within power-off windows. Once delivered, sub-metered consumption is visible by floor and by device.
SaaS or private deployment, with account permissions assigned by department and building. Once delivered, facility staff can check the numbers and export reports themselves, without calling the vendor each time.
Peak and off-peak split, sub-metering structure and anomaly thresholds follow the client’s own definitions, and schedules and linked strategies are pushed out together. Once delivered, monthly reports can be used directly for assessment, and before and after the retrofit can be compared.
Includes O&M training and data reconciliation methods. New circuits can be added by following the manual.
The full solution
Breakers, monitoring terminals and the management platform are configured together, so energy and safety share one set of data.
Hardware
Metering and switching in one device, so a retrofit needs no separate meter box.
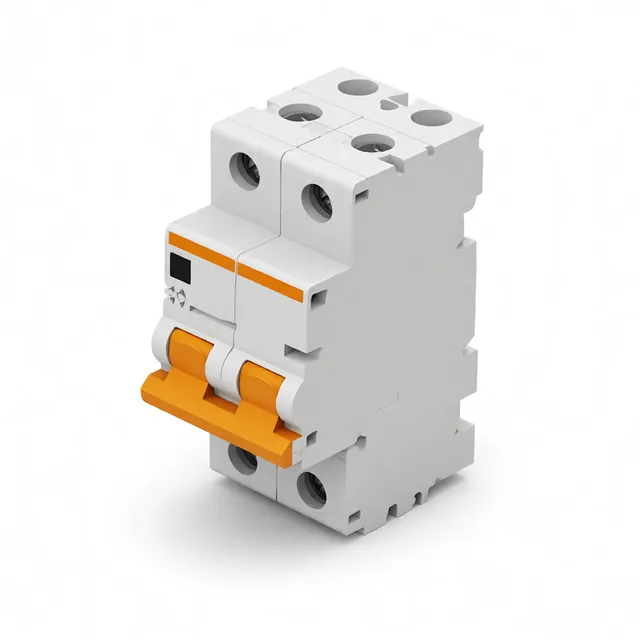 Smart circuit breaker
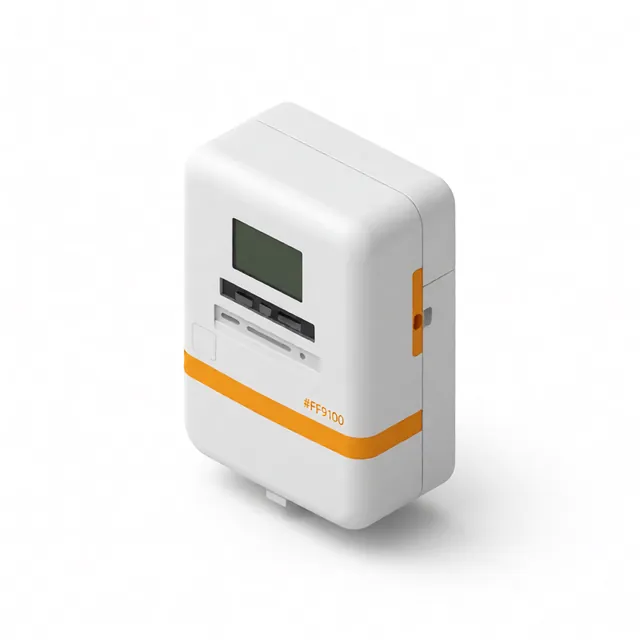 Smart power meter
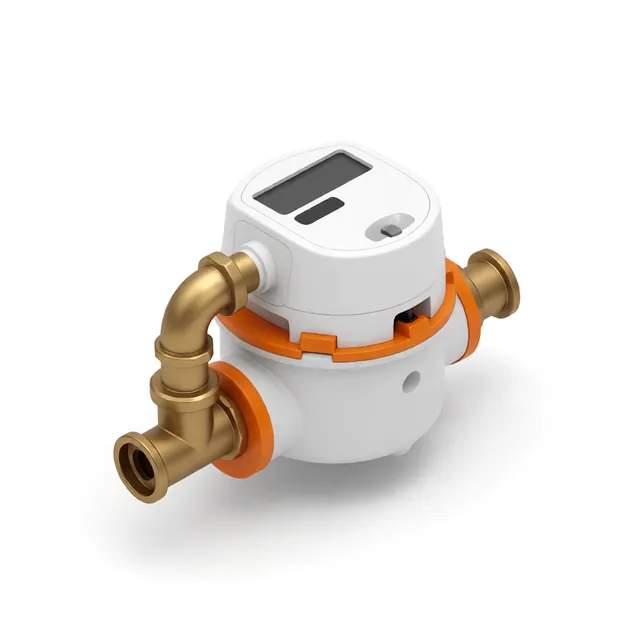 Smart water meter
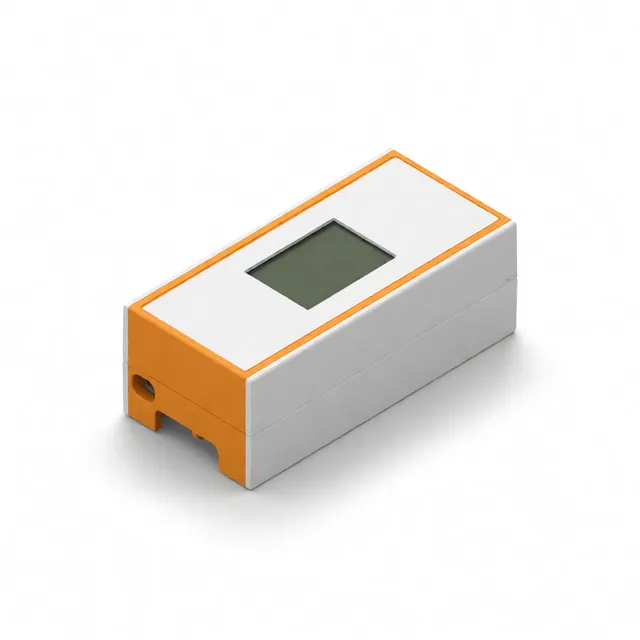 Multi-circuit monitoring terminal
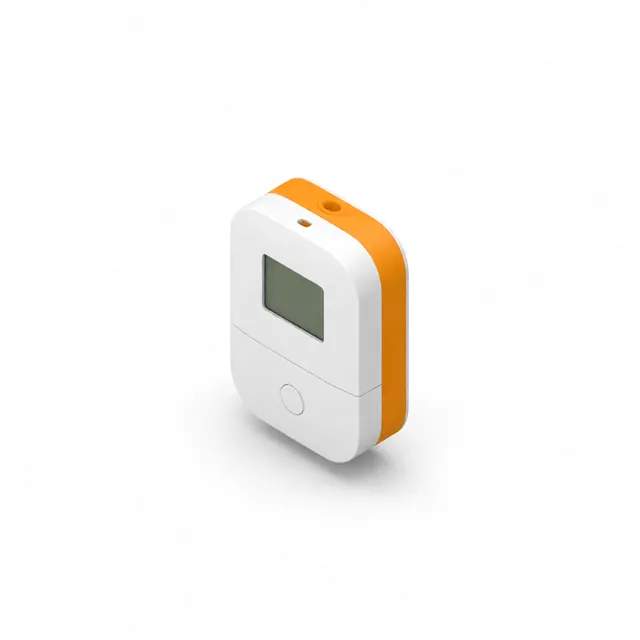 Temperature & humidity sensor
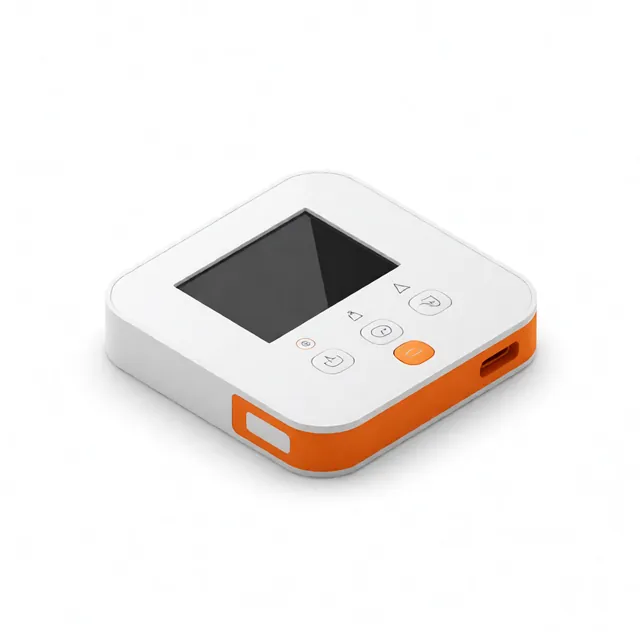 Air conditioner panel
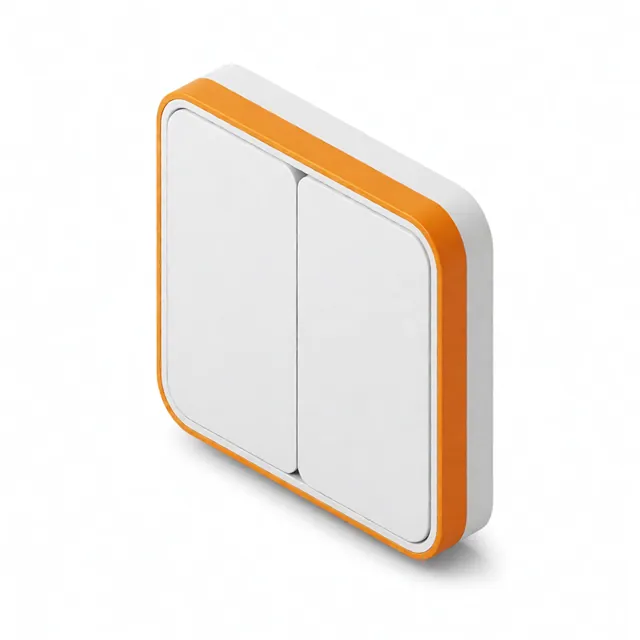 Smart lighting module
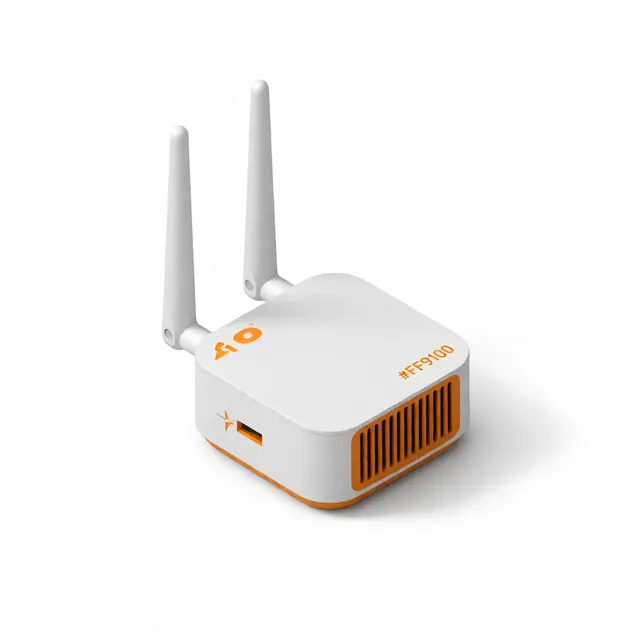 IoT gateway
Advantages
One electricity bill at month end becomes an energy structure traceable by day and by circuit, which supports management decisions.
Electrical safety and energy management share one platform, so there are no two systems run by two teams.
The Zhuhai Technician College project saves about 30% of electricity every month.
Industry SaaS with standard hardware onboarding gives a predictable implementation timeline. With ecosystem partners, it can also support source-grid-load-storage integration.
Case studies
Smart control of lighting, air conditioning and power in dormitories and classrooms, saving about 30% of electricity every month.
View case → ProjectSmart control of air conditioning and lighting lowers energy use and carbon emissions, setting an energy-saving benchmark for public service facilities.
View case → ProjectAI-driven platform for fine-grained energy management.
View case →Explore more
Tell us about your product and target scenario. We’ll reply within one business day with an initial proposal and price range. Or call us at +86 756 268 1500.